The Emission Level Change of Air Pollutants Since the Implementation of the Total Air Pollutant Emission-Cap Management System
Abstract
This study analyzed the emission trend of power generation facilities after the implementation of the Total Air Pollutant Emission-Cap Management System (TAPEMS) and the effect of its introduction by comparing the concentration with facilities in areas where the TAPEMS was not implemented. Since the introduction of the TAPEMS, the average concentration of nitrogen oxide (NOx) emissions from power generation facilities has decreased by 58% and sulfur oxides (SOx) by 51%, so even though the number of power generation facilities subject to the TAPEMS has increased, the total pollutant emission and sulfur oxides were reduced by 39% and 47%, respectively, compared to the maximum levels (NOx in 2010, SOx in 2013). By fuel, solid fuel power generation facilities showed the largest reduction by 65% in 2019 compared to 2008 in both nitrogen oxides and sulfur oxides, followed by gas fuel (NOx 55%) and liquid fuel (NOx 32%, SOx 14%). As a result of analyzing the net policy effect of the TAPEMS by comparing the concentration with power generation facilities in non-metropolitan areas, the introduction of the TAPEMS resulted in 16.9% (36,663 tons) of nitrogen oxides and 31.3% (31,532 tons) of sulfur oxides were further reduced, and when converted into social costs due to air pollution, it was calculated to reach 576,484 million won.
초록
본 연구에서는 수도권의 산업시설의 대기오염물질을 줄이기 위해 2008년 대기총량제가 시행된 이후 발전시설의 배출 추이를 분석하고, 대기총량제 미시행 지역의 발전시설 농도와 비교하여 대기총량제 도입효과를 분석하고자 하였다. 대기총량제 도입 이후 발전시설의 질소산화물 평균 배출농도는 58%, 황산화물은 51% 낮아져 총량대상 발전시설 수가 증가했음에도 전체 오염물질 배출량은 최대치 (NOx ’10년, SOx ’13년) 대비 질소산화물 39%, 황산화물 47%가 오히려 감소하였다. 연료별로는 고체연료 발전시설이 ’08년 대비 ’19년 질소산화물과 황산화물이 모두 65% 저감되어 가장 큰 저감 폭을 보였고, 기체연료 (NOx 55%), 액체연료 (NOx 32%, SOx 14%) 순으로 저감률이 높았다. 비 수도권 지역 발전시설과 농도 비교를 통해 대기총량제의 순수한 정책 효과를 분석한 결과 ’10~’18년 (9년) 기간 동안 대기총량제 도입으로 질소산화물 16.9% (36,663톤), 황산화물 31.3% (31,532톤)가 추가 저감되었고 이를 대기오염으로 인한 사회적 비용으로 환산하면 576,484백만 원에 달하는 것으로 산출되었다.
Keywords:
Total Air Pollutant Emission-Cap Management System (TAPEMS), Best Available Control Technology (BACT), Emission of power plantKeywords:
대기총량제, 최적방지시설, 발전부문 대기오염질 배출량1. Introduction
Owing to the concentration of population, automobiles and industrial facilities, the metropolitan area of South Korea has a more severe level of air pollution than non-metropolitan areas and other major cities in developed countries (Kim, 2013). The estimated economic damage cost of Korea in 2060 due to air pollution is analyzed to be the highest among OECD countries (OECD, 2016), and various studies estimate that economic damage is caused by 1 trillion to 4 trillion KRW per year due to health effects and restrictions on production activities (Min, 2019; An et al., 2017).
Accordingly, the Korean government established ‘Master plan for air environment management in the Seoul metropolitan area’ to improve air quality in the metropolitan area and enacted a special law on air environment improvement in the metropolitan area in 2005. The Total Air Pollutant Emission-Cap Management System (TAPEMS) is being implemented for workplaces in the metropolitan area to reduce pollutants in the industrial field since July 2007.
TAPEMS was designed to manage air pollutants in the metropolitan area within the appropriate environmental capacity by overcoming the limitations of the existing chimney concentration regulation method, which is difficult to reduce emissions from low-concentration-high-flow facilities (KMOE and KEITI, 2020). TAPEMS targets Seoul, Incheon, and 28 cities in Gyeonggi-do that are recognized as having serious air pollution in the metropolitan area (Table 1), and the target substances are nitrogen oxides, sulfur oxides, and TSP (Total Suspended Particulate). However, the implementation of the TSP was delayed for about 10 years due to technical problems in calculating emissions, and then implemented in 2018 (KMOE, 2017).
TAPEMS allocates the allowable amount of air pollutants to be emitted by workplaces every five years, and the target workplace must discharge the smaller number of pollutants than the allowable amount each. In case of exceeding the total emission amount, fines are levied at the target workplaces, and incentives, such as non-application of fuel sulfur content standards, partial relaxation of emission standards, and exemption from emission charges, are also being applied.
The total amount of allowed emission allocated to each workplace is calculated by comprehensively considering the reduction plan in the Master plan, the operation rate of each workplace, and the level of Best Available Control Technology (BACT). Especially, the standard for BACT has been strengthened and the allowance has been reduced to induce investment in prevention facilities at business sites.
This study analyzes the emission concentration trend after the introduction of TAPEMS in power generation facilities that emit 82% of nitrogen oxides and 75% of sulfur oxides in the metropolitan area (KECO and KTL, 2007), and calculates the effect of the system, and also suggests directions for improvement of the system.
2. Experimental Section
2. 1 Investigation for the Reinforcement of the Standard Concentration of BACT
Among air pollutant reduction technologies, the standards for BACT, which can be currently applied or mean the level of technologically feasible and cost-effective prevention facilities (KMOE, 2020), are periodically strengthened in accordance with the development of prevention facility technology, and this is specified in Annex 1 of the Enforcement Rules of the Air Management Area Act (formerly Special Act on Atmospheric Improvement in the Metropolitan Area). The history of strengthening the standard concentration of the BACT applied to power generation facilities was investigated by examining the history of amendments to laws and regulations.
2. 2 Emission Trend of Power Plants Subject to TAPEMS
The emission concentration trend of power generation facilities was investigated by classifying them according to fuel properties and facility types, and analyzing data for a total of 11 years from 2008, when TAPEMS was introduced, to 2019. Fuel properties were classified into solid, liquid, gaseous fuels, and facility types were mainly divided into thermoelectric power plant and combined heat & power plant. Thermoelectric power plant drives a turbine with the power of steam, and combined heat & power plant generates primary power by rotating a gas turbine, and produces steam using high-temperature and high-pressure exhaust gas to drive the steam turbine for secondary power generation (KMOE, 2014). The concentration and emission data used in the study were extracted from the ‘Workplace Air Pollutant Management System (www.stacknsky.or.kr)’. Concentration data was selected for large outlets equipped with Stack Tele-Monitoring System (STMS), and data on emissions and fuel consumption included small outlets calculated by emission coefficient and self-measurement in addition to outlets with STMS. The target analyte materials were nitrogen oxides and sulfur oxides, and TSP was excluded.
2. 3 The Effect Analysis of the Implementation of TAPEMS
In addition to TAPEMS, workplaces that emit air pollutants are subject to various regulations, such as emission concentration standards (Air Act), environmental impact assessment consultation standards, local government ordinances, and integrated environmental management (from 2017). However, the most differentiated atmospheric policy between the metropolitan area and non-metropolitan areas was TAPEMS. The net effect of TAPEMS was calculated by comparing the emission concentrations of the metropolitan and non-metropolitan workplaces. The emission concentration was compared with the data for 9 years, from 2010 to 2018, and facilities where it is difficult to clearly know the concentration depending on the fuel using two fuels were excluded from the analysis target.
3. Results and Discussion
3. 1 Reinforcement of Standard Concentration of BACT
The standard concentration of BACT used in calculating the allowance has been strengthened twice (in 2013 and 2018) after the TAPEMS was implemented in 2008. However, in 2020, when the TAPEMS is expanded to the whole country, some of the BACT standards have been relaxed so that new workplaces can settle into the TAPEMS stably.
Tables 2 and 3 summarize the reinforcement details of the BACT standards. From 2008 to 2018, the BACT standard for nitrogen hydroxide in power generation facilities was strengthened from 33% (solid fuel-fired power generation) to 80% (solid-liquid-gas combined power generation, etc.). However, facilities installed before the implementation of the TAPEMS applied relaxed BACT standards.
The BACT standard for sulfur oxides has been strengthened from 29% (liquid fuel-fired power generation) to 67% (gaseous fuel power generation, etc.).
3. 2 Emissions Trend of Power Generation Facilities and Effect of Introduced TAPEMS
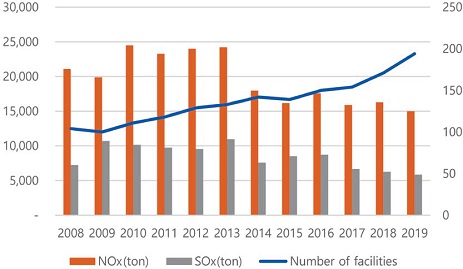
Even though the number of target workplace has steadily increased due to target grade (class 1 → class 1~3) and regional (including 4 cities in Gyeonggi-do) expansion since the implementation of the TAPEMS in 2008, emissions in 2019 was decreased down to 39% for nitrogen oxides and 47% for sulfur oxides of maximum amounts (NOx in 2010, SOx in 2013), respectively (Fig. 1).
The emission concentration of all power generation facilities in 2019 decreased by 58% (53.1 → 22.5 ppm) for nitrogen oxides and 51% (62.3 → 30.8 ppm) of sulfur oxides compared to 2008 (Table 4). This indicates that the emission decrease is made by the decrease of emission concentration.
3. 3 Power Generation Facility using Solid Fuel
In 2019, most of the power generation facilities using solid fuel subject to TAPEMS used bituminous coal as fuel (99.7%) and some of them used wood (0.3%).
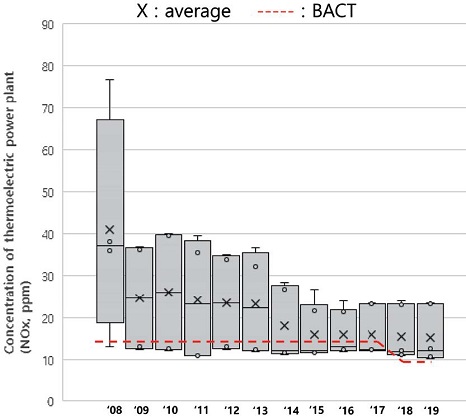
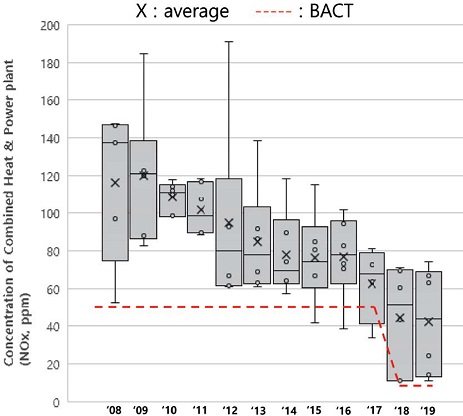
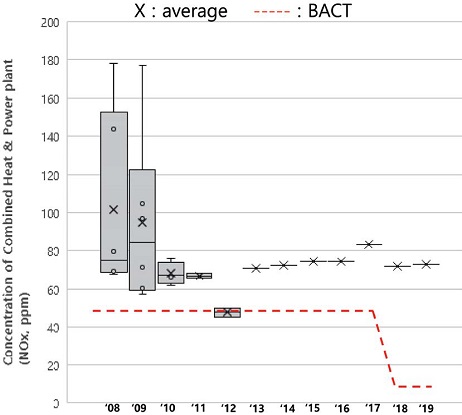
Table 5 shows the nitrogen oxide concentration by year of power generation facilities. After the introduction of TAPEMS, the average concentration of nitrogen oxides in solid fuel-using facilities decreased by 65% (82.6 → 28.8 ppm). By facility, Thermoelectric power plants decreased by 63% (40.9 → 15.3 ppm) and combined heat and power plants decreased by 64% (116.0 → 42.2 ppm).
The BACT standard for thermal power generation facilities using solid fuel was strengthened to 15 ppm by 2017 and 10 ppm after 2018. Compared with the BACT standard applied until 2017, the emission concentration was lowered from 273% (2008) to 107% (2017) of the BACT (Fig. 2). The BACT concentration of cogeneration facilities was strengthened from 50 ppm by 2017 to 10 ppm after 2018, and the emission concentration was lowered from 232% in 2008 to 125% in 2017 (Fig. 3).
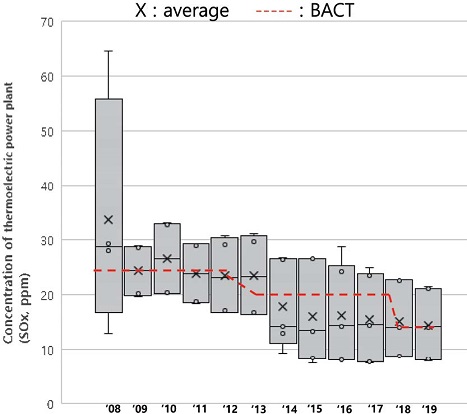
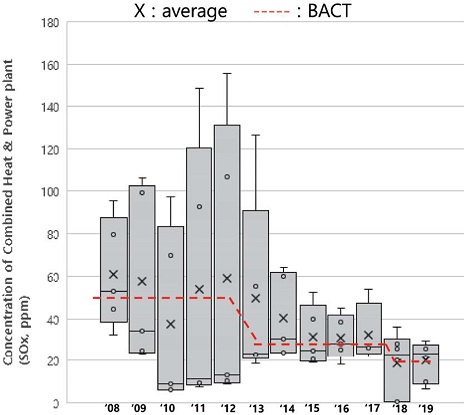
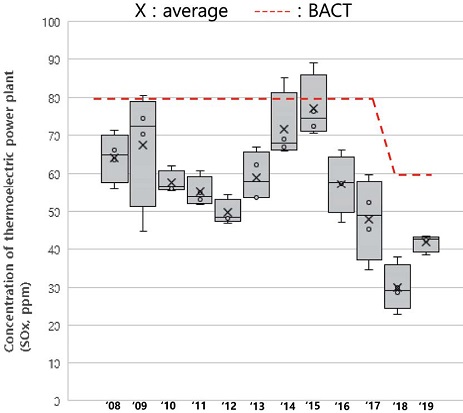
Sulfur oxides from power generation facilities using solid fuel decreased by 65% (48.8 → 17.3 ppm) in 2018 compared to 2008. Those of thermal power generation facilities and cogeneration facilities decreased by 57% (33.7 → 14.5 ppm) and 67% (60.8 → 20.2 ppm), respectively (Table 6).
The sulfur oxide BACT standard for thermal power plants was strengthened to 25 ppm by 2012 and 20 ppm by 2017. In 2008, the level was 167% compared to the reinforced BACT, but in 2017, the level was 77%, meeting the BACT standard (Fig. 4). The BACT standard for cogeneration facilities was strengthened to 50 ppm by 2012 and 25 ppm by 2017. It was decreased to 243% in 2008 and 130% in 2017 compared to 2017 BACT (Fig. 5).
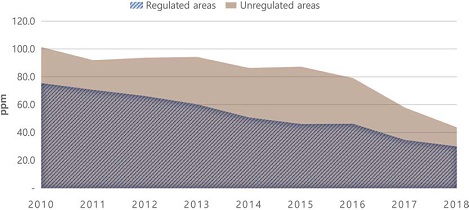
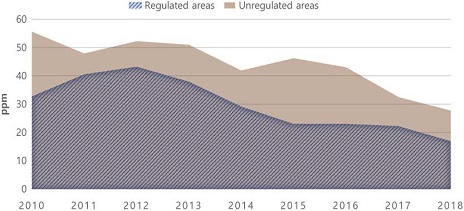
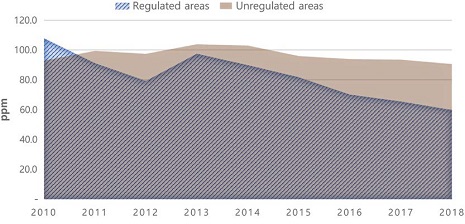
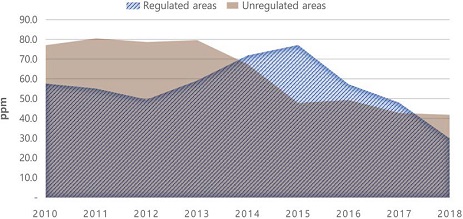
In order to calculate the net effect of the TAPEMS, the emission concentration was compared with the solid fuel power generation facility located in the non-metropolitan area. As shown in Figs. 6 and 7, it was found that nitrogen oxides and sulfur oxides were lower by about 32% and sulfur oxides by about 30% at the target workplaces. Although the difference in concentration between workplaces subject to and not subject to the TAPEMS system is gradually decreasing due to the strengthening of concentration standards and the upward leveling of emission reduction technology, the performance indicates that the emission concentration in facilities subject to the TAPEMS is consistently low.
If the above concentration difference is converted into emission amounts, 25,146 tons of nitrogen oxides and 29,571 tons of sulfur oxides were reduced for 9 years (2010~2018) due to the introduction of the TAPEMS (Tables 7, 8).
3. 4 Power Generation Facility using Liquid Fuel
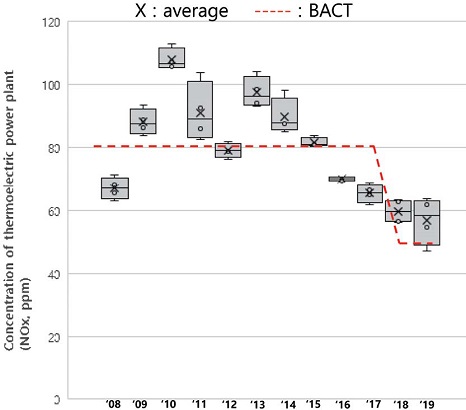
Liquid fuels used in power generation facilities subject to TAPEMS are bunker C (BC) oil, low Sulfur Waxy Residue (LSWR) mainly and their portions were 89% for BC oil and 11% for LSWR, respectively. After the introduction of the TAPEMS, the average concentration of nitrogen oxides decreased by 32% (87.6 → 59.9 ppm) in liquid fuel-using facilities, by 15% (67.0 → 56.7 ppm) in thermal power generation facilities, and by 28% (101.3 → 72.5 ppm) in cogeneration facilities (Table 9).
Thermal power generation facilities using liquid fuel have 4 outlets at one business site, and they were installed before the implementation of the TAPEMS and are subject to the relaxed BACT standards. As shown in Fig. 8, the emission concentration gradually decreases as the BACT standard is strengthened.
Although it seems that the emission concentration of cogeneration facilities has not decreased since 2010, in terms of the number of facilities, 3 of 6 liquid fuel-using facilities in 2008 were converted to LNG, and 2 facilities were closed (Fig. 9). Therefore, the overall pollution level was decreased. The fuel consumption of power generation facilities after the introduction of the TAPEMS, the consumption of liquid fuel in power generation facilities decreased and the consumption of gaseous fuel, which emits relatively little pollutants, increased (Table 10).
One facility, which has been operating continuously since 2008, is emitting the higher concentration pollutants than the BACT standard (Fig. 9). The operation rate of this plant shows a decreasing trend every year, and it was over-allocated by the pre-improvement allocation method (~2017), which allocates based on the maximum operation rate during the past period. Since 2018, this has been improved and allocation is made based on the average operation rate instead of the maximum operation rate.
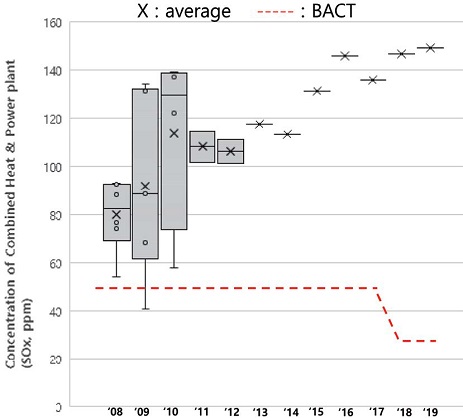
As shown in Table 11, after the introduction of the TAPEMS, the average concentration of sulfur oxides using liquid fuel decreased by 14% (73.6 → 63.2 ppm) in power generation facilities and by 35% (64.2 → 41.7 ppm) in thermal power generation facilities decreased. However, that was increased by 87% (79.8 → 149.0 ppm) in cogeneration facilities.
Thermal power plants subject to the relaxed BACT standards for existing installations gradually decreased in concentration as the BACT standards were strengthened (Fig. 10). In cogeneration facilities as with nitrogen oxides, the number of facilities decreased from 6 to 1, but the emission concentration of one facility currently in operation did not decrease (Fig. 11), and a allowance reducing the emission more than 50% of 2017 until 2022 was allocated to that facility by improving the allocation method.
Comparing the concentration with liquid fuel-using thermal power generation facilities in non-metropolitan areas, plants subject to the TAPEMS emit 15% less nitrogen oxides and 6% lower sulfur oxides than non-targeted plants on average (Figs. 12, 13).
As shown in Table 12, if the effect of the introduction of the TAPEMS is converted into emissions, 2,063 tons of nitrogen oxides and 1,961 tons of sulfur oxides were reduced for 9 years (2010~2018).
In the case of liquid fuel power plants, the effect of introducing the TAPEMS was smaller than that of solid fuel facilities. The low effect can be explained by the relaxed BACT standards applied to liquid fuel power plant. Another factor is that sufficient incentives for facility investment have not occurred by allocating facilities whose utilization rates are on a declining trend based on the past maximum utilization rates.
In the Air Management Area Act, which was newly established due to the nationwide expansion of the TAPEMS, the relaxed BACT standard is applied to facilities installed before 2015. For active investment in facility improvement of existing facilities, it seems desirable to apply the same BACT standard to all facilities after 2025.
3. 5 Power Generation Facility using Gas Fuel
Types of gaseous fuel include LNG, LFG (Land Fill Gas), LPG, biogas, and by-product gas. LNG accounts for 98.8% of the total, so the concentration analysis targeted LNG-using facilities with a high proportion of use and did not analyze sulfur oxides with insignificant occurrence. Also, concentration analysis was conducted without classifying facilities because most of the facilities using LNG are internal combustion engines for power generation. Only one facility used thermal power generation.
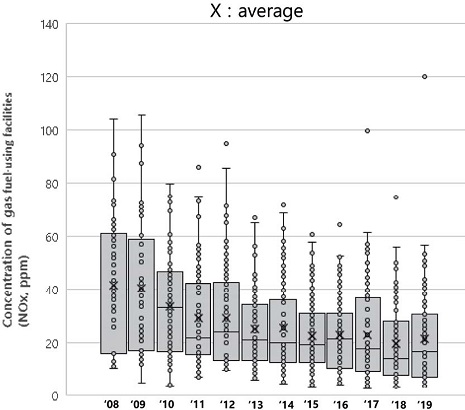
The nitrogen oxide concentration of gas-fueled power plants decreased by 55% (41.6 → 18.8 ppm) in 2018 compared to 2008 (Table 14). BACT standards are classified according to the amount of power generation but compared with the most strengthened BACT standard for cogeneration (10 MW or more, 10 ppm), in 2008, it was lowered from 416% to 188% in 2019 (Fig. 14).
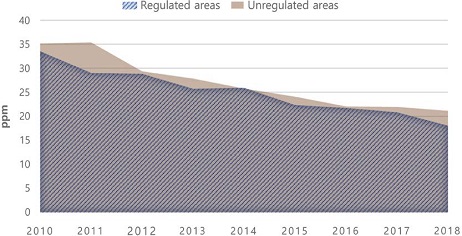
Compared to the concentration with LNG power generation facilities in non-metropolitan areas, those in the facilities subject to the TAPEMS emitted 7% lower nitrogen oxide (Fig. 15). According to major policy pillars such as the Master Plan for Energy and the Master Plan for Power Supply and Demand, the pro-portion of LNG power generation is increasing, and the emission standards applied to LNG power generation have recently been greatly strengthened. In addition, non-metropolitan areas where the TAPEMS was not implemented are judged to have low emission levels because various prevention facilities such as low-temperature catalysts can be applied due to the nature of gaseous fuels that do not emit sulfur oxides and particulate matter (Kim et al., 2020).
If the difference in concentration between workplaces subject to and not subject to the TAPEMS is considered as the effect of introducing the TAPEMS and converted into emissions, the amount of nitrogen oxides reduced between 2010 and 2018 is 9,453 tons (Table 15).
The proportion of LNG power generation is expected to increase further under the national energy policy, which sets the reduction of nuclear and coal power plants and the expansion of renewable energy (MOTIE, 2019). Currently, LNG power plants are mainly responsible for peak load of power demand, but in the near future, they will play a major role in supporting base generation and stabilization of renewable energy. It is necessary to pay attention to the wide range of NOx concentration in LNG power plants ranging from 3.3 to 56.6 ppm, and to review the system improvement so that LNG power plants with low pollution levels are operated first through the TAPEMS. In the power generation market, power supply is ranked in descending order of unit price. In general, nuclear power plants have the lowest fuel cost, followed by coal, gas, and oil power plants (Kim and Shin, 2018). The unit price of power generation is mainly determined by the fuel cost, and the cost of greenhouse gas emission is also included (KPX, 2021). If the electricity market operation rules are amended to include the cost of NOx & SOx emission in the electricity generation cost, the TAPEMS will be able to contribute to the realization of environmental power supply in which eco-friendly facilities are operated first. However, it is necessary to increase the cost of purchasing emission to the extent that the priority order can be reversed, and for this, it is necessary to consider methods such as the introduction of allowance auctioning for the power generation industry and the strengthening of BACT standards (e.g., the top 10% level).
3. 6 Social Benefits of TAPEMS
Air pollution can have damaging impacts on human health, productivity, and the health of the environment. These detrimental impacts have an associated economic or social cost (Ricardo E&E, 2019). The amount of air pollutants reduced by the implementation of TAPEMS was converted into social costs using the coefficient suggested by Ricardo E&E (2019).
As shown in Table 16, a total of 36,663 tons of NOx reduction for 9 years (2010-2018) due to the TAPEMS resulted in social benefits of KRW 308,231 million. The social benefits of solid fuel-using facilities accounted for the largest share at KRW 211,408 million.
A total of 31,532 tons of sulfur oxides were further reduced, resulting in social benefits of KRW 268,253 million. As with nitrogen oxides, the greatest benefit occurred in solid fuel-using facilities.
4. Conclusions
This study analyzed the emission trend of power generation facilities after the implementation of the TAPEMS and the effect of its introduction by comparing the concentration with facilities in areas where the TAPEMS was not implemented. Since the introduction of the TAPEMS, the average concentration of nitrogen oxide emissions from power generation facilities has decreased by 58% and sulfur oxides by 51%, so even though the number of power generation facilities subject to the total amount has increased, the total pollutant emission and sulfur oxides were reduced by 39% and 47%, respectively, compared to the maximum levels (NOx in 2010, SOx in 2013).
As a result of analyzing the effect of TAPEMS by comparing the concentration with power generation facilities in non-metropolitan areas, the emission concentration of nitrogen oxide and sulfur oxide is lower by 16.9 % and 31.3% than that of power generation facilities in non-metropolitan. If the difference in concentration is converted into emissions, the amount of pollutant reduction for 9 years (2010~2018) is 36,663 tons of nitrogen oxides and 31,532 tons of sulfur oxides, and the social cost saved by the emission reduction was calculated to be 576,484 million won.
However, facilities with relaxed BACT standards due to the previous installation of the TAPEMS are analyzed to have a minimal emission reduction effect, so the relaxed BACT application should be applied with a certain period of time to induce active facility improvement.
In a situation where the proportion and role of LNG power generation increases, it is also necessary to consider a plan to link the TAPEMS with the electricity market, such as including the cost of NOx & SOx allowances in the power generation cost to preferentially operate facilities with low nitrogen oxide emissions. In this process, it is also necessary to consider introducing an allowance auctioning system to the power generation industry or strengthening the BACT standard for increasing emissions costs.
References
- An, S.-E., Kim, J.-O., Jo, Y.-R., Um, Y.-S., Kwak, S.-Y., Bae, H.-J. (2017) Assessment of human health effects of air-pollution using cohort DB and estimation of economic costs in Korea (III), KEI Policy Task Research Report, 2017, 1-130.
-
Kim, D.-S. (2013) Air Pollution History, Regulatory Changes, and Remedial Measures of the Current Regulatory Regimes in Korea, Journal of Korean Society for Atmospheric Environment, 29(4), 353-368, (in Korean with English abstract).
[https://doi.org/10.5572/KOSAE.2013.29.4.353]

- Kim, N.-I., Shin, H.-C. (2018) A study on electricity market operation plan considering environmental power supply, KEEI Occasional Research Report, pp. 3-5.
- Kim, Y.-M., Choi, H.-J., Seo, J.-H., Lee, S.-M., Park, G.-H., Shin, M.-S. (2020) Research on Improving the Management of Air Pollutants Emitted from LNG Cogeneration Facilities. KEI Research Report, p. 42.
- Korea Environment Corporation (KECO), Korea Testing Laboratory (KTL) (2007) Preparation of effective compliance measures for the total volume management system for business sites in the metropolitan area, p. 79.
- Korea Ministry of Environment (KMOE) (2014) Explanation of air pollutant emission facilities, p. 231, ISBN 11-1480000-001225-01.
- Korea Ministry of Environment (KMOE) (2017) Implementation of fine dust countermeasures such as the phased implementation of the total amount of dust in the metropolitan area, Press release.
- Korea Ministry of Environment (KMOE) (2020) Business Manual of Air Pollutant Emission-Cap Management System, p. 4, ISBN 11-1470000-001650-01.
- Korea Ministry of Environment (KMOE), Korea Environmental Industry & Technology Institute (KEITI) (2020) Air environment regulation trends and countermeasures, p. 7.
- Korea Ministry of Trade, Industry and Energy (MOTIE) (2019) 3rd Energy Master Plan, p. 33.
- Korea Power Exchange (2021) Power Market Operating Rules, p. 3.
- Min, J.-W. (2019) Public perception survey on fine dust - The economic cost of fine dust is estimated to be 4 trillion won per year, Hyundai Research Institute, Weekly Economic Review, 2019(833), p. 2.
- Organization for Economic Co-operation and Development (OECD) (2016) The Economic Consequences of Outdoor Air Pollution, p. 90.
- Ricardo Energy & Environment (Ricardo E&E) (2019) Air Quality damage cost update 2019, p. 39.
- Special Act on the Improvement of Air Quality in Seoul Metropolitan Area (2020.3.24), Article 16(1, 3).
모태영 (서울시립대학교 환경공학부 박사과정, 한국환경공단 기후대기본부 과장)
김영민 (대구대학교 환경공학과 교수)
박영권 (서울시립대학교 환경공학부 교수)

