코사인 유사도 (Cosine Similarity)를 이용한 2021 서해상 대기질 입체관측 (YES-AQ) 캠페인 기간 내화성 Black Carbon (rBC) 관측자료 유효성 분석
 ; Min Jae Jeong
 ; Sangmin Oh ; Chu-Yong Chung1)
 ; Shanlan Li
 ; Saehee Lim2)
 ; Jeong Eun Kim
 ; Kyung-On Boo
Abstract
Black Carbon (BC) is an important substance that affects global warming and it is highly observed in the Asian continent. Aerosols including BC pass through the Yellow Sea and they cause adverse effects on South Korea. However it is not easy to understand the aerosol characteristics and movement over the Yellow Sea due to the sparse observation. The NIMS/KMA (National Institute of Meteorological Sciences/Korea Meteorological Administration) introduced a YES-AQ (Yellow Sea-Air Quality) campaign every spring since 2018, and tried to observe BC from the atmospheric research aircraft, NARA (NIMS Atmospheric Research Aircraft). The NARA observes number concentrations and mass concentrations of BC single particles using SP2 (Single Particle Soot Photometer), and the light absorption coefficient of BC using TAP (Tricolor Absorption Photometer) with three wavelengths. In order to analyze the validity of the 550 nm light absorption coefficient observed from TAP, the similarity was confirmed by comparing the measurements of the 550 nm light scattering coefficient from Nephelometer during the 2021 YES-AQ campaign. In addition, as a result of verifying the light absorption coefficient measurement in TAP and the rBC (refractory BC) mass concentrations measurement in SP2 using the Cosine Similarity method, it was confirmed that the tendency showed good agreement with cosine similarity of 0.953±0.033.
Keywords:
rBC mass concentration, 550 nm light absorption coefficient, 550 nm light scattering coefficient, NARA, YES-AQ1. 서 론
대기 중 에어로졸 (aerosol)은 주로 탄소, 질소, 황으로 구성되어 있고, PM2.5 중 탄소성 에어로졸은 약 40%를 차지하는 주요 화학성분이다 (Lim et al., 2012). 탄소성 에어로졸은 크게 검댕 (BC, Black Carbon) 또는 무기탄소 (EC, Elemental Carbon) 및 유기탄소 (OC, Organic Carbon) 입자로 구성된다. 이 중 다양한 배출원과 생성과정을 포함하는 유기탄소와 달리 BC는 주로 화석연료 연소 (fossil fuel burning)와 식생연소 (biomass burning) 과정에서 대기로 직접 방출되는 일차생성 입자이다 (Bond et al., 2013). BC는 가시광선을 강하게 흡수하는 광흡수물질로 지구 온난화에 영향을 미치는 것으로 알려져 있다 (IPCC, 2021). 특히, 고도에 따른 대기 중 BC 농도의 차이는 에어로졸의 복사강제력 (BC GWP, Global Warmming Potential: 0.4 W/m2) 및 지구의 알베도 (albedo)에 큰 영향을 미친다 (Suresh Babu et al., 2008; Haywood and Ramaswamy, 1998).
전 지구적으로 대기 중 BC는 중국과 인도를 중심으로 아시아대륙에서 높게 관측되고 있다 (Chung and Seinfeld, 2005). 특히, BC의 입경은 수농도가 주로 100 nm 이하에 집중되어 나타나는 나노 (nano) 입자이기 때문에 (Lim et al., 2019, 2014b, 2012) 인체에 심각한 영향을 미친다고 보고되고 있으며 (Janssen et al., 2012, 2011), 타 대륙까지 쉽게 이동하는 것으로 알려져 있다 (Lim et al., 2017). BC와 같은 에어로졸 및 오염물질은 대륙에서 배출되어 우리나라에 대기질 악화 현상을 유발할 수 있으나, 서해상은 관측 공백 지역으로 국내로 유입되는 오염물질의 특성과 변화과정을 이해하기에 한계가 있다.
본 연구에서는 2021 서해상 대기질 입체관측 (YES-AQ, Yellow Sea-Air Quality) 캠페인 기간에 기상항공기 나라호 (NARA, NIMS (National Institute Meteorological Sciences) Atmospheric Research Aircraft)에 탑재된 탄소 에어로졸 관측장비 (SP2, Single Particle Soot Photometer, DMT Inc.)를 이용하여 관측한 내화성 BC (rBC, refractory BC) 질량농도와 삼색흡수광도계 (TAP, Tricolor Absorption Photometer, BMI Inc., BMI 2901)를 이용하여 관측한 550 nm 광흡수계수를 비교하여 rBC 질량농도 관측 결과를 검증하고자 한다.
2. 관측 및 분석 방법
2. 1 서해상 대기질 입체관측 (YES-AQ)
국립기상과학원 (NIMS)은 2018년부터 관련 연구기관과 공동으로 기상관측선 기상1호와 나라호, 지상관측소 및 위성을 활용하여 서해상을 통해 유입되는 대기오염물질과 기후변화 원인물질에 대한 입체감시를 강화하고 기후변화 대응의 과학적 근거를 제시하고자 YES-AQ를 수행하고 있다 (Shin et al., 2022; Kang et al., 2021; Yoo et al., 2021). 그림 1의 안면도 (AMY, Anmyeondo), 제주고산 (JGS, Juju Gosan), 울릉도독도 (ULD, Ulleungdo·Dokdo)는 국립기상과학원에서 운영하는 기후변화감시 기본관측소이며, 서울대학교 (SNU, Seoul National University), 한국표준과학연구원 (KRISS, Korea Research Institute of Standards and Science)은 YES-AQ에 참여하여 지상에서 관측하는 기관이다.
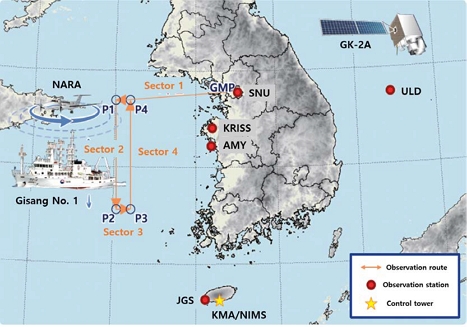
YES-AQ campaign observation configuration and area using meteorological aircraft NARA, meteorological observatory vessel Gisang No. 1, GK-2A satellite, ground observatory (red circle), and controll tower (yellow star). (Sector 1 to 4 are the observation route of the meteorological aircraft NARA and meteorological observatory vessel Gisang No. 1).
특히, 봄철은 장거리 이동물질로 인해 황사가 많이 발생하여 다른 계절에 비해 상대적으로 고농도의 에어로졸이 관측되기 때문에 YES-AQ 캠페인은 매년 3~5월 사이 봄철에 수행하고 있다 (Shin et al., 2022).
2. 2 항공관측
2021 YES-AQ 캠페인은 2021년 3월 22일부터 4월 29일까지 총 39일간 수행이 되었으며, 2021 YES-AQ 캠페인의 일부로 나라호를 이용한 항공관측은 2021년 3월 23일, 3월 29일, 3월 30일, 4월 14일, 4월 16일, 4월 17일, 4월 28일, 4월 29일 총 8회 수행되었다 (그림 2, 표 1).
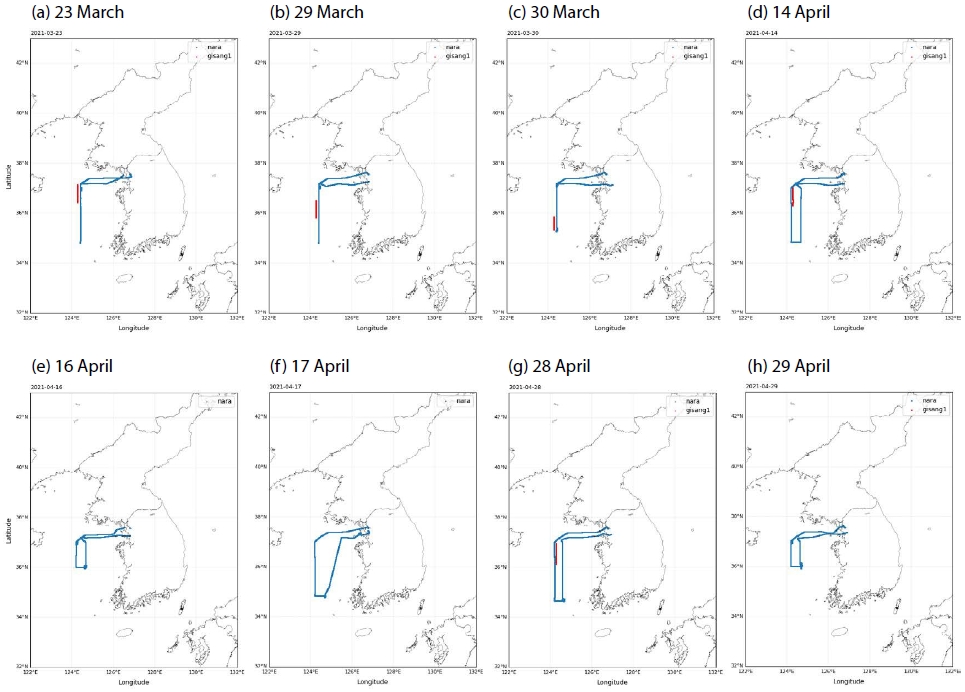
2021 YES-AQ campaign period NARA aircraft and Gisang No. 1 route. - flight route of NARA aircraft, - route of Gisang No. 1 moved during NARA aircraft flight time (a: 23 March, b: 29 March, c: 30 March, d: 14 April, e: 16 April, f: 17 April, g: 28 April, h: 29 April).
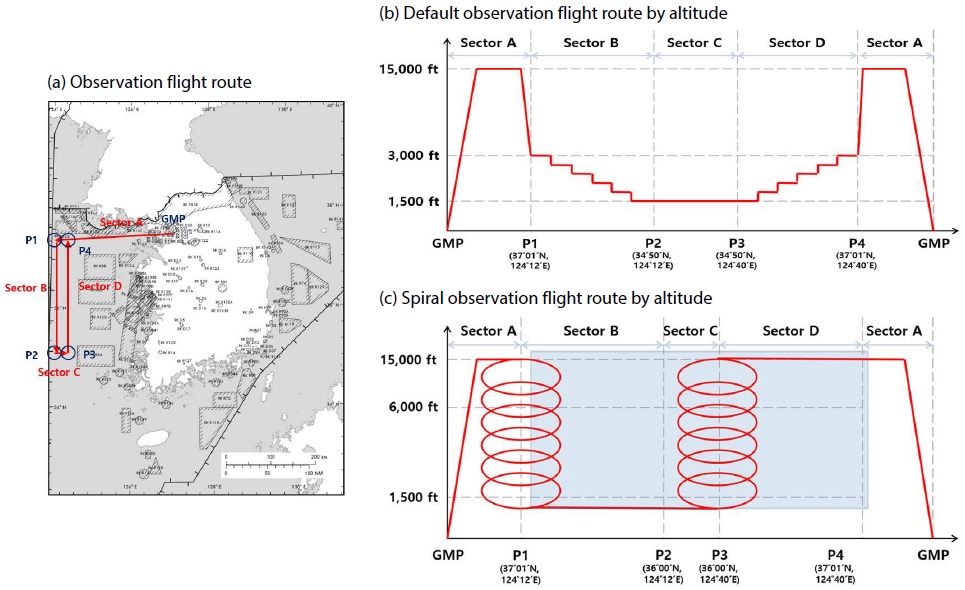
항공관측 기본 운항 경로는 그림 3a와 같이 김포공항에서 출발하여 서해상의 남북 방향으로는 124°12′E~124°40′E, 동서 방향으로는 37°01′N~34°50′N까지 이동하였다. 고도는 황사 등의 에어로졸 플룸의 유입 및 이동 경로에 따라서 그림 3b 기본 운항 경로와 그림 3c 나선관측 운항 경로를 선택하여 항공관측을 실시하였다.
2. 3 에어로졸 광학 특성 관측장비 및 관측원리
국립기상과학원은 2017년도에 Beechcraft사에서 제작한 King Air 350HW 모델을 기상항공기 나라호로 도입하여 구름물리 관측 및 기상조절 실험, 위험기상 선행관측, 환경기상 감시, 온실가스 감시 4가지 임무를 수행하고 있다. 그림 4와 표 2는 환경기상 감시를 위해 나라호에 설치된 관측장비 목록이다. 환경기상 감시 임무 중 에어로졸 광학적 특성 관측을 위해서 광흡수는 TAP과 SP2를, 광산란은 광산란계수관측기 (Nephelometer, TSI Inc., TSI 3563)를 탑재하였다. 탄소성 에어로졸 중 EC는 일반적으로 필터 기반의 열광학적 투과법 (thermal-optical transmittance method) 또는 열광학적 반사법 (thermal-optical reflectance method)으로 질량농도를 직접 산출한다. 이에 비해 equivalent BC (eBC)는 광원을 이용하여 빛의 흡수량을 관측하여 농도로 환산하는 방식으로 산출하며, 대표적인 관측기로는 광흡수계수관측기 (aethalometer)를 들을 수 있다. Aethalometer는 롤 필터에 채취된 시료를 통해 투과된 빛이 감소하는 정도를 관측하는 방법으로 대기 중 실시간 BC의 질량농도를 관측하기 위해 가장 많이 사용되는 장비이다 (Hansen et al., 1984). 그러나 이 방법은 eBC의 bulk 특성을 관측하므로 BC 단일입자의 특성을 파악하지 못하는 단점이 있다. 이를 보완하기 위해 나라호에는 2018년부터 SP2를 탑재하여 단일 rBC 입자의 질량농도 및 수농도를 관측하고 있다 (Yoo et al., 2022). SP2는 레이저로 백열을 유도해 BC 단일입자를 관측하는 방법 (LII, Laser Induced Incandescence method)을 사용한다. BC 입자가 1,064 nm 레이저 빛을 흡수하면 기화온도 이상에서 질량에 비례하는 백열 에너지를 방출한다. 이때 관측되는 BC를 rBC라 한다. 또한, SP2는 단일 BC 입자의 입경을 산출할 수 있는 유일한 장비로 알려져 있다 (Lim et al., 2019; Sharma et al., 2017; Miyzkawa et al., 2016; Wang et al., 2014). SP2는 rBC의 수농도, 질량농도 및 입경 (50~500 nm)을 높은 시간 해상도 (0~25,000 particles/sec)로 관측하므로 배출 특성 조사 및 항공관측에 적합하여 주로 미국, 유럽, 일본을 중심으로 연구가 수행되었고, 최근 중국에서도 연구가 활발하게 진행되고 있다 (Kang et al., 2021; Zheng et al., 2019; Metcalf et al., 2012; Kondo et al., 2011). 국내 에서는 봄철 제주 중산간지대 (Oh et al., 2015)와, 여름철 서울 불광동 (Park et al., 2019)의 대기 중 rBC 관측 연구가 수행되었다. 또한, 나라호에 탑재된 SP2의 검증을 위해 Lim et al. (2019)에 의해 지상에서 rBC 질량 및 수농도 분석을 하였으며, Kang et al. (2021) 은 서해 상공에서 rBC의 수직분포 특성을 분석하였다.
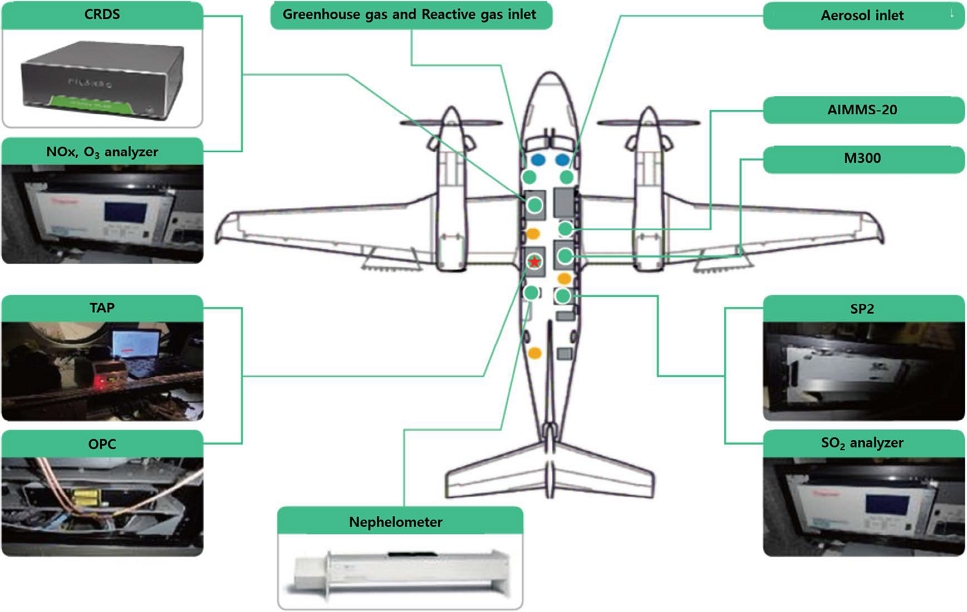
Environmental monitoring mission observation analyzer installed in NARA aircraft (Cavity Ring-Down spectroscopy (CRDS): Greenhouse gases (carbon dioxide, methane, carbon monoxide) measurement), (NOx, O3 analyzer: NOx and Ozone measurement), (TAP: aerosol light absorption coefficient), (Optical Particle Counter (OPC): Aerosol volume size distribution), (Nephelometer: aerosol light scattering coefficient), (SO2 analyzer: SO2 measurement), (SP2: rBC number and mass concentration), (M300: observation data storage device), (AIMMS-20: weather observation analyzer).
SP2에서 관측된 rBC 질량농도 검증을 위해 비교 대상장비는 TAP을 사용하였다. TAP은 에어로졸을 포집한 필터 (sample)와 포집되지 않은 필터 (reference)에 광원을 투과시켜 빛이 흡수되는 양의 차이로 3파장 (467, 528, 652 nm)의 광흡수계수를 관측하는 기기이다 (Ogren et al., 2017). TAP 관측자료 유효성을 확인하기 위해 Nephelometer를 사용하였다. Nephelometer는 광원과 수직으로 위치하는 광학 관측장치를 통 해 기체 분자나 에어로졸에 의해 산란되는 빛을 기하학적으로 적분하여 산란계수를 관측하는 기기이며 (Ruby and Waggoner, 1981), 산란각 오차보정, 표준상태 변환 등의 후처리는 Anderson and Ogren (1998)의 연구에서 제시한 방법을 따랐다.
2. 4 분석 방법
SP2에서 관측되는 rBC 질량농도 검증에 앞서 TAP 관측자료의 유효성을 확인하기 위해 2021 YES-AQ 캠페인 기간 TAP에서 관측된 528 nm 광흡수계수를 Nephelometer와 동일한 파장 (450, 550, 750 nm)으로 변환시킨 후 표준온도 및 압력 (273.15K, 1.013 hPa) 상태로 보정한 550 nm 광흡수계수를 Nephelomter로 관측한 550 nm 광산란계수와 비교 분석하였다. Sharma et al. (2017)에 의하면 캐나다 Alert에서 BC를 관측한 결과에 대하여 장비별 보정과 불확도를 계산한 결과 eBC 및 EC가 rBC에 비해 월평균 값이 약 1.5~2배 큰 것을 확인하였고, Pileci et al. (2021)은 2010~2017년 동안 유럽의 Palaiseau, Bologna, Cabauw 및 Melpitz 4개 지점에서 관측한 rBC와 EC의 질량농도 비율 (mrBC/mEC)을 0.92±1.5로 보고하였다. 또한, Wang et al. (2014)은 2011년 10월 중국 Tibetan Plateau에서 rBC와 eBC의 농도를 비교 관측한 결과 Xi’an은 자동차 배출 및 석탄연소의 영향으로 eBC가 1.28 높으며, QHL (Qinghai Lake)은 노천 소각 (open biofuel burning)의 영향으로 2.49 높게 관측되었다고 보고하였다. Lim et al. (2014a)은 눈과 빙하의 BC를 관측한 결과 시료별 평균 0.5~3.4의 EC/rBC 비율로 나타났으며, BC의 입자크기 및 조성 등에 따라서 rBC와 EC의 농도와 비율에 차이가 나는 것을 밝혔다.
앞서 연구한 선행 연구에 의하면 나라호에서 BC 특성을 관측한 rBC 질량농도와 TAP에서 관측된 550 nm 광흡수계수는 직접 비교가 어렵다는 점이 확인되었다.
벡터를 이용하여 계산하는 상관성 분석에는 두 자료의 코사인 각도를 계산하는 코사인 유사도 (Cosine Similarity) 그리고 두 자료 (vector)의 표본평균으로 정규화 (normalization)를 하고, 코사인 유사도를 구하는 피어슨 유사도 (Pearson Similarity)가 있다.
피어슨 유사도의 경우 식 (1)과 같으며, 일반적으로 상관관계를 구할 때 가장 많이 사용되지만, 두 자료의 크기에 따라 유사도가 증감되는 경향이 있다.
| (1) |
따라서 자료의 크기가 아닌 방향의 유사성을 확인하기 위하여 본 연구에서는 코사인 유사도를 사용하였다. 그 식은 다음과 같다 (Mana and Sasipraba, 2021).
| (2) |
| (3) |
SP2와 TAP에서 산출된 rBC 질량농도와 550 nm 광흡수계수 관측값의 증가 또는 감소하는 방향이 완전히 동일하게 양의 상관성을 가지는 경우 1의 값을 가지며, 각각 관측값이 상관성이 없다면 0, 음의 상관성을 가지면 -1의 값을 갖게 된다. 코사인 유사도는 -1부터 1까지의 값을 가지며 값이 1에 가까울수록 유사도가 높다고 판단한다. 즉, 코사인 유사도는 두 관측자료가 증가와 감소하는 추세가 얼마나 상관성을 가지는가를 판단할 수 있다 (Song et al., 2021, https://wikidocs.net/24603).
3. 결 과
3. 1 에어로졸 광흡수계수 유효성
2021 YES-AQ 캠페인 기간 중 항공관측이 있었던 총 8회 중 광흡수계수가 결측된 3월 30일, 4월 16일, 4월 17일 3회를 제외한 5회 (2021년 3월 23일, 3월 29일, 4월 14일, 4월 28일, 4월 29일)의 에어로졸 광산란계수와 광흡수계수를 그림 5에 정리하였다. 일반적으로 에어로졸 광흡수계수는 광산란계수의 크기가 1/10 수준이기 때문에 축 크기를 1/10로 하여 나타내었다. 3월 23일 (그림 5a)은 고도 1 km 이하에서 550 nm 광산란계수와 550 nm 광흡수계수가 증가하였고, 고도 1 km 이상에서 감소하는 유사한 패턴으로 관측이 되었다. 하지만, 고도 4 km 이상 구간과 급격하게 고도를 낮추는 구간에서는 550 nm 광흡수계수 관측값의 노이즈 현상이 나타났다. 3월 29일 (그림 5b)은 강한 황사가 유입되어 수도권에서 5년 만에 황사 경보가 발령된 날이며, 기상1호에서는 PM10 질량농도 최댓값이 1,384 µg/m3까지 관측되었다. 나라호 관측 결과, 고도 1 km 부근에서 550 nm 광산란계수와 550 nm 광흡수계수가 각각 500 Mm-1, 26 Mm-1까지 증가하였다. 550 nm 광산란계수와 550 nm 광흡수계수 간 비율 차이는 있지만 증감은 유사하게 관측되었다. 하지만, 3월 23일 (그림 5a)과 마찬가지로 고도를 낮추는 구간과 고도 4 km 이상에서는 550 nm 광흡수계수의 관측값의 노이즈 현상이 나타났다. 그림 5(c) 4월 14일 (그림 5c)은 그림 3(b)에서 설명한 항공관측 기본 운항 경로 고도 1 km 이하에서 관측을 수행했던 날이며, 전 구간에서 550 nm 광산란계수와 550 nm 광흡수계수의 관측값의 증감이 유사하였다. 4월 28일 (그림 5d)은 황사가 유입된 날로 3월 29일 (그림 5b)과 마찬가지로 550 nm 광산란계수와 550 nm 광흡수계수 간 비율의 차이는 있지만 증감 구간이 유사하였다. 하지만, 4월 28일의 경우에도 급격하게 고도가 증가하는 구간과 3 km 구간에서 550 nm 광흡수계수의 관측값의 노이즈 현상이 나타났다. 4월 29일 (그림 5e)은 550 nm 광산란계수와 550 nm 광흡수계수 간의 차이가 10배 이상 나타나고 있었으며, 이는 광산란을 일으키는 에어로졸이 서해상에 많이 존재하고 있었던 것으로 풀이된다.
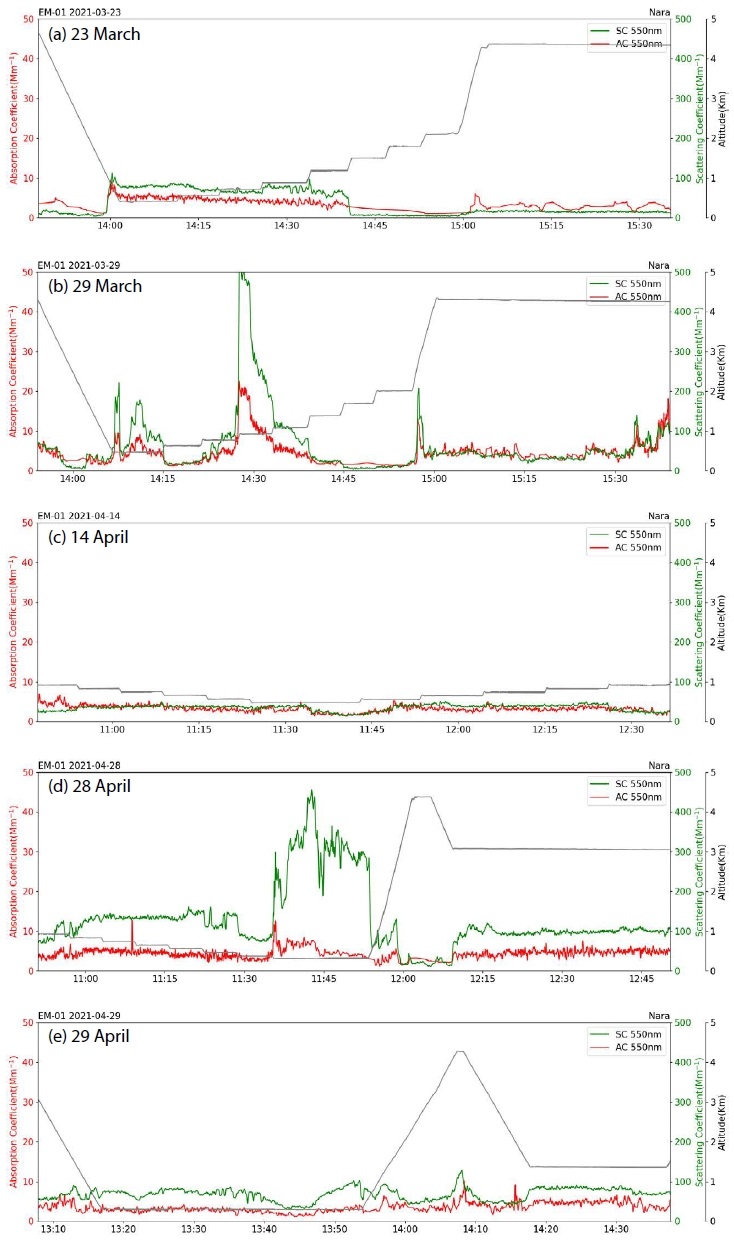
550 nm light scattering coefficient and 550 nm light absorption coefficient measurement results from NARA aircraft. - NARA aircraft operating altitude, • 550 nm light scattering coefficient (Nephelometer), • 550 nm light absorption coefficient (TAP), (a: 23 March, b: 29 March, c: 14 April, d: 28 April, e: 29 April).
결과적으로 나라호의 고도가 급격히 변경되는 구간과 3 km 이상의 고도 구간에서는 관측값의 노이즈 현상을 지속적으로 보였으나, 고도 1 km 이하 구간의 경우 550 nm 광산란계수와 550 nm 광흡수계수 간의 관측값이 10배라는 일반적인 차이를 보여 TAP 관측자료의 유효성을 확인할 수 있었다.
3. 2 rBC 질량농도와 550 nm 광흡수계수 유사성
2021 YES-AQ 기간 중 3.1절에서 분석한 기간과 동일 기간에 대하여 서해상공의 rBC 질량농도를 산출한 후 550 nm 광흡수계수와 코사인 유사도 비교 분석을 시도하였다.
3월 23일 (그림 6a)은 고도 1 km 이하에서 rBC 질량농도가 증가하는 것으로 확인되었으며, 550 nm 광흡수계수와 비교한 결과 코사인 유사도가 0.960으로 고도변경에 따른 농도 변동 추세가 일치하는 것으로 관측되었다. 3월 29일 (그림 6b)은 3.1절에서 말하였듯이 강한 황사가 유입되었던 날이다. rBC 질량농도와 550 nm 광흡수계수 모두 고도 약 1 km 구간에서 증가하는 경향을 보였다. 하지만, 급격히 고도가 변경되는 구간과 고도 4 km 이상의 고도 구간에서 550 nm 광흡수계수의 변동이 심하여 코사인 유사도는 0.829로 다른 관측일보다 낮은 경향성을 보였다. 4월 14일 (그림 6c)은 고도 약 1 km 구간에서 rBC와 550 nm 광흡수계수의 관측 경향에 약간 차이를 보였으나, 그 외의 구간에서는 경향성이 일치하여 코사인 유사도가 0.984로 매우 높은 상관성을 보였다. 4월 28일 (그림 6d)은 단계적으로 고도가 0.3 km까지 낮아지는 구간에서는 rBC 질량농도와 550 nm 광흡수계수의 경향성이 유사하였으나, 고도가 4 km까지 급격히 높아지는 구간에서는 차이가 발생하여 코사인 유사도는 0.906으로 강한 황사가 유입되었던 3월 29일 다음으로 낮은 경향성을 보였다. 4월 29일 (그림 6e)은 고도 4 km 지점에서 rBC 질량농도는 큰 변동이 없었으나, 550 nm 광흡수계수는 9 Mm-1으로 증가하면서 차이를 보였다. 코사인 유사도는 0.961로 두 관측장비의 관측값은 높은 상관성을 나타냈다.
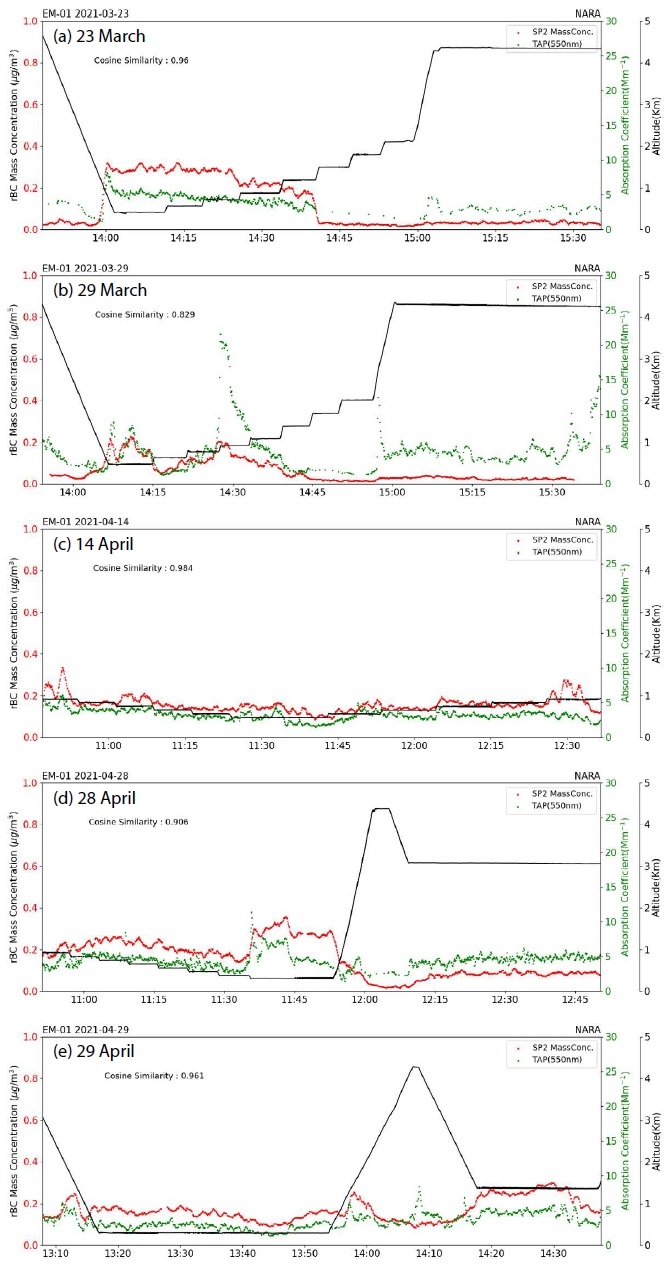
Measurement result of rBC mass concentration and aerosol light absorption coefficient (- NARA aircraft flight altitude, • rBC mass concentration, • 550nm light absorption coefficient (a: 23 March, b: 29 March, c: 14 April, d: 28 April, e: 29 April).
유사도 분석 결과 3월 29일 관측을 제외한 3월 23일, 4월 14일, 4월 28일, 4월 29일에서 코사인 유사도가 0.953±0.033으로 높은 상관성을 보여 나라호에서 SP2로 생산하는 rBC 관측자료를 신뢰할 수 있는 수준으로 해석된다.
4. 결 론
기상항공기 나라호에서 관측하는 rBC 질량농도의 검증을 위해 나라호에서 관측한 528 nm 광흡수계수를 550 nm 광흡수계수로 변화하여 비교 분석하였다. rBC 질량농도를 관측하는 SP2는 rBC 단일입자에 대하여 질량농도를 산출하지만, 528 nm 광흡수계수를 관측하는 TAP은 에어로졸이 포집된 sample 필터와 포집되지 않은 reference 필터에 광원을 투과시켜 bulk 형식으로 관측하기 때문에 직접적인 비교가 어렵다고 판단되어 코사인 유사도를 이용하여 경향성을 분석하였다. 두 관측 결과 비교에 앞서 TAP에서 관측된 528 nm 광흡수계수의 유효성을 확인하기 위해 광산란계수와 동일한 파장인 550 nm 광흡수계수로 변환한 후 나라호에서 관측된 550 nm 광산란계수와 비교 분석하였다. 나라호에서 관측된 550 nm 광산란계수와 550 nm 광흡수계수 비교 결과 전반적으로 증가와 감소의 변동이 유사하여 나라호에서의 TAP 관측이 잘 이루어진 것으로 판단할 수 있었다. 하지만, 나라호의 고도가 급격히 변경되는 구간과 3 km 이상의 고도 구간에서는 550 nm 광흡수계수 값에 변동이 발생하는 것을 확인하였으며, 이는 TAP을 이용하여 항공관측을 수행하는 과정에서 발생하는 관측 불확도로 판단된다. 또한, 황사가 유입되었던 3월 29일과 4월 28일의 경우 rBC 질량농도와 550 nm 광흡수계수 관측 추세는 유사하였으나 두 관측값이 크게 차이나는 것을 확인할 수 있었는데, TAP과는 달리 SP2의 관측범위는 50~500 nm로 황사와 같이 2 µm 이상의 조대입자로 존재하는 입자에 대하여 관측이 불가하기 때문이다. TAP의 관측 불확도와 두 관측장비 간 관측 범위 차이에 의해 코사인 유사도가 낮게 관측된 3월 29일을 제외한 3월 23일 (0.960), 4월 14일 (0.984), 4월 28일 (0.906), 4월 29일 (0.961) 4일에 대한 코사인 유사도의 평균은 0.953±0.033으로 rBC 질량농도와 550 nm 광흡수계수 관측값의 상관성이 높게 나타나 관측자료의 안정성을 확인할 수 있었다.
국립기상과학원은 2019년부터 2020년까지 기상항공기 나라호에 탑재된 SP2 관측자료 분석을 위해 고려대학교와 분석기술을 공동 개발하였다. 본 연구는 국립기상과학원에서 SP2를 자체 운영하면서 연구한 첫 번째 사례로써 의미를 가지며, 이 결과를 통해 SP2 관측자료의 신뢰도를 확보하였다. 향후 rBC의 수농도, 부피농도 및 코팅 두께, 노후화 등의 연구를 계속 진행하여 BC의 기원 추적 및 변화과정 등 특성 규명이 가능할 것으로 기대한다. 또한, 기상1호, 나라호 및 지상의 기후변화감시소에서 관측된 에어로졸 광학 특성 자료를 활용하여 에어로졸의 유형 분석과 시간, 계절, 공간에 따른 질량흡수단면 (MAC, Mass Absorption Cross) 평가분포를 통한 광흡수효율에 대해 연구를 지속하여 수행한다면 eBC의 관측 농도와 BC의 광흡수에 의한 복사강제력 분야의 기후예측 불확도를 줄이는 데 기여할 수 있을 것으로 예상된다.
Acknowledgments
이 연구는 기상청 국립기상과학원 「기상업무지원기술개발연구」 “황사·연무 감시 및 예보기술 개발 (KMA2018-00521)”의 지원으로 수행되었습니다. 국립기상과학원 관측연구부 기상항공기운영센터의 지원에 감사드립니다.
References
-
Anderson, T.L., Ogren, J.A. (1998) Determining aerosol radiative properties using the TSI 3563 integrating Nephelometer, Aerosol Science and Technology, 29, 57-69.
[https://doi.org/10.1080/02786829808965551]

-
Bond, T.C., Doherty, S.J., Fahey, D.W., Forster, P.M., Berntsen, T., DeAngelo, B.J., Flanner, M.G., Ghan, S., Kärcher, B., Koch, D., Kinne, S., Kondo, Y., Quinn, P.K., Sarofim, M.C., Schultz, M.G., Schulz, M., Venkataraman, C., Zhang, H., Zhang, S., Bellouin, N., Guttikunda, S.K., Hopke, P.K., Jacobson, M.Z., Kaiser, J.W., Klimont, Z., Lohmann, U., Schwarz, J.P., Shindell, D., Storelvmo, T., Warren, S.G., Zender, C.S. (2013) Bounding the role of black carbon in the climate system: A scientific assessment, Journal of Geophysical Research: Atmospheres, 118(11), 5380-5552.
[https://doi.org/10.1002/jgrd.50171]

-
Chung, S.H., Seinfeld, J.H. (2005) Climate response of direct radiative forcing of anthropogenic black carbon, Journal of Geophysical Research: Atmospheres, 110(D11), D11102.
[https://doi.org/10.1029/2004JD005441]

-
Hansen, A., Rosen, H., Novakov, T. (1984) The Aethalometer - an instrument for the real-time measurement of optical obsorption by aerosol particles, Science of The Total Environment, 36, 191-196.
[https://doi.org/10.1016/0048-9697(84)90265-1]

-
Haywood, J.M., Ramaswamy, V. (1998) Global Sensitivity Studies of the Diret Radiative Forcing Due to Anthropogenic Sulfate and Black Carbon Aerosols, Journal of Geophysical Research: Atmospheres, 103, 6043-6058.
[https://doi.org/10.1029/97JD03426]

- IPCC, Climate Change 2021 (2021) The Physical Science Bases, Chapter 7 The Earth’s Energy Budget, Climate Feedbacks, and Climate Sensitivity. https://www.ipcc.ch/report/ar6/wg1/downloads/report/IPCC_AR6_WGI_Chapter07.pdf
- Janssen, N.A.H., Gerlofs-Nijland, M.E., Lanki, T., Salonen, R.O., Cassee, F., Hoek, G. (2012) Health effects of black carbon, WHO Regional Office for Europe, Copenhagen, Denmark.
-
Janssen, N.A.H., Hoek, G., Simic-Lawson, M., Fischer, P., van Bree, L., ten Brink, H., Keuken, M., Atkinson, R.W., Anderson, H.R., Brunekreef, B., Cassee, F.R. (2011) Black Carbon as an Additional Indicator of the Adverse Health Effects of Airborne Particles Compared with PM10 and PM2.5, Environmental Health Perspectives, 119(12), 1691-1699.
[https://doi.org/10.1289/ehp.1003369]

-
Kang, Y., Lim, S., Lee, M.H., Yoo, H.-J. (2021) Vertical Distributions of Refractory Black Carbon over the Yellow Sea during the Spring 2020, Journal of Korean Society for Atmospheric Environment, 37(5), 710-728, (in Korean with English abstract).
[https://doi.org/10.5572/KOSAE.2021.37.5.710]

-
Kondo, Y., Oshima, N., Kajino, M., Mikami, R., Moteki, N., Takegawa, N., Verma, R.L., Kajii, Y., Kato, S., Takami, A. (2011) Emissions of Black Carbon in East Asia Estimated from Observations at a Remote Site in the East China Sea, Journal of Geophysical Research: Atmospheres, 116(16), 1-14.
[https://doi.org/10.1029/2011JD015637]

-
Lim, S., Faïn, X., Ginot, P., Mikhalenko, V., Kutuzov, S., Paris, J.-D., Kozachek, A., Laj, P. (2017) Black carbon variability since preindustrial times in the eastern part of Europe reconstructed from Mt. Elbrus, Caucasus, ice cores, Atmospheric Chemistry and Physics, 17(5), 3489-3505.
[https://doi.org/10.5194/acp-17-3489-2017]

-
Lim, S., Fain, X., Zanatta, M., Cozic, J., Jaffrezo, J.-L., Ginot, P., Laj, P. (2014a) Refractory black carbon mass concentrations in snow and ice: method evaluation and intercomparison with elemental carbon measurement, Atmospheric Measurement Techniques, 7, 3307-3324.
[https://doi.org/10.5194/amt-7-3307-2014]

-
Lim, S., Kang, Y., Lee, M., Yoo, H.-J., Lee, S.-S., Lee, G.-H. (2019) Mass Concentration and Size Distribution of Refractory Black Carbon in Seoul during Summer, Journal of Korean Society for Atmospheric Environment , 35(6), 713-725, (in Korean with English abstract).
[https://doi.org/10.5572/KOSAE.2019.35.6.713]

-
Lim, S., Lee, M., Kim, S.-W., Yoon, S.-C., Lee, G., Lee, Y.J. (2014b) Absorption and scattering properties of organic carbon versus sulfate dominant aerosols at Gosan climate observatory in Northeast Asia, Atmospheric Chemistry and Physics, 14(15), 7781-7793.
[https://doi.org/10.5194/acp-14-7781-2014]

-
Lim, S., Lee, M., Lee, G., Kim, S., Yoon, S., Kang, K. (2012) Ionic and carbonaceous compositions of PM10, PM2.5 and PM1.0 at Gosan ABC Superstation and their ratios as source signature, Atmospheric Chemistry and Physics, 12(4), 2007-2024.
[https://doi.org/10.5194/acp-12-2007-2012]

-
Mana, S.C., Sasipraba, T. (2021) Research on Cosine Similarity and Pearson Correlation Based Recommendation Models, Journal of Physics: Conference Series, 1770, 012014,
[https://doi.org/10.1088/1742-6596/1770/1/012014]

-
Metcalf, A.R., Craven, J.S., Ensberg, J.J., Brioude, J., Angevine, W., Sorooshian, A., Duong, H.T., Jonsson, H.H., Flagan, R.C., Seinfeld, J.H. (2012) Black Carbon Aerosol over the Los Angeles Basin during CalNex, Journal of Geophysical Research: Atmospheres, 117(8), 1-24.
[https://doi.org/10.1029/2011JD017255]

-
Miyakawa, T., Kanaya, Y., Komazaki, Y., Taketani, F., Pan, X., Irwin, M., Symonds, J. (2016) Intercomparison between a single particle soot photometer and evolved gas analysis in an industrial area in Japan: Implications for the consistency of soot aerosol mass concentration measurements, Atmospheric Environment, 127, 14-21.
[https://doi.org/10.1016/j.atmosenv.2015.12.018]

-
Ogren, J.A., Wendell, J., Andrews, E., Sheridan, P.J. (2017) Continuous light absorption photometer for long-Term studies, Atmospheric Measurement Techniques, 10(12), 4805-4818.
[https://doi.org/10.5194/amt-10-4805-2017]

-
Oh, J., Park, J., Lee, S., Ahn, J., Choi, J., Lee, S., Lee, Y., Kim, H., Hong, Y., Hong, J., Kim, J., Kim, S., Lee, G. (2015) Characteristics of black carbon particles in ambient air using a single particle soot photometer (SP2) in May 2013, Jeju, Korea, Journal of Korean Society for Atmospheric Environment, 31(3), 255-268, (in Korean with English abstract).
[https://doi.org/10.5572/KOSAE.2015.31.3.255]

-
Park, J., Song, I., Kim, H., Lim, H., Park, S., Shin, S., Shin, H., Lee, S., Kim, J. (2019) The characteristics of black carbon of Seoul, Journal of Environment Impact Assessment, 28(2), 113-128, (in Korean with English abstract).
[https://doi.org/10.14249/eia.2019.28.2.113]

-
Pileci, R.E., Modini, R.L., Bertò, M., Yuan, J., Corbin, J.C., Marinoni, A., Henzing, B., Moerman, M.M., Putaud, J.P., Spindler, G., Wehner, B., Müller, T., Tuch, T., Trentini, A., Zanatta, M., Baltensperger, U., Gysel-Beer, M. (2021) Comparison of co-located refractory black carbon (rBC) and elemental carbon (EC) mass concentration measurements during field campaigns at several European sites, Atmospheric Measurement Techniques, 14, 1379-1403.
[https://doi.org/10.5194/amt-14-1379-2021]

-
Ruby, M.G., Waggoner, A.P. (1981) Intercomparison of integrating nephelometer measurements, Environmental Science & Technology, 15, 109-113.
[https://doi.org/10.1021/es00083a014]

-
Sharma, S., Richard Leaitch, W., Huang, L., Veber, D., Kolonjari, F., Zhang, W., Hanna, S.J., Bertram, A.K., Ogren, J.A. (2017) An evaluation of three methods for measuring black carbon in Alert, Canada, Atmospheric Chemistry and Physics, 17(24), 15225-15243.
[https://doi.org/10.5194/acp-17-15225-2017]

-
Shin, D., Kim, J.E., Chung, C.-Y., Yoo, H.-J. (2022) Aerosol physical characteristics over the Yellow Sea using optical particle counter measurement data onboard Gisang 1 vessel during YES-AQ campaign, Journal of Korean Society for Atmospheric Environment, 38(2), 203-219, (in Korean with English abstract).
[https://doi.org/10.5572/KOSAE.2022.38.2.203]

-
Song, B.H., Jung, H., Kim, K. (2021) Textual analysis of climate action plans of global cities, Journal of Energy and Climate Change Education, 11(2), 135-151, (in Korean with English abstract).
[https://doi.org/10.22368/ksecce.2021.11.2.135]

-
Suresh Babu, S., Satheesh, S.K., Krishna Moorthy, K., Dutti, C.B.S., Nair, V.S., Alappattu, D.P., Kunhikrishnan, P. K. (2008) Aircraft Mesaurements of Aerosol Black Carbon from a Coastal Location in the North-Est Part of Peninsular India during ICARB, Journal of Earth System Science, 177(SUPPL. 1), 263-271.
[https://doi.org/10.1007/s12040-008-0030-1]

-
Wang, Q., Schwarz, J.P., Cao, J., Gao, R., Fahey, D.W., Hu, T., Huang, R.-J., Han, Y., Shen, Z. (2014) Black carbon aerosol characterization in a remote area of Qinghai-Tibetan Plateau, western China, Science of The Total Environment, 479-480, 151-158.
[https://doi.org/10.1016/j.scitotenv.2014.01.098]

- Wikipedia, Cosine Similarity Method. https://en.wikipedia.org/wiki/Cosine_similarity
-
Yoo, H., Kim, K.A., Lee, Y. ,Zihui, T., Yoo, H.J., Kim, J., Ko, H.J., Sung, M.Y., Choi, J.S., Park, J.S. (2021) Characteristics of Carbonaceous and Organic Components in PM2.5 over the Yellow Sea, Atmosphere, 31(3), 267-282, (in Korean with English abstract).
[https://doi.org/10.14191/Atmos.2021.31.3.267]

-
Yoo, H.-J., Kim, S., Chung, C.-Y., Kim, Y.-H. (2022) A Study on the Improvement of Observation Analyzer for Reactive Gases (SO2, O3, NOX) Monitoring Research in the Atmospheric Research Aircraft NARA, Journal of the Korean Society of Urban Environment, 22(1), 1-8, (in Korean with English abstract).
[https://doi.org/10.33768/ksue.2022.22.1.1]

-
Zheng, H., Kong, S., Wu, F., Cheng, Y., Niu, Z., Zheng, S., Yang, G., Yao, L., Yan, Q., Wu, J., Zheng, M., Chen, N., Xu, K., Yan, Y., Liu, D., Zhao, D., Zhao, T., Bai, Y., Li, S., Qi, S. (2019) Intra-Regional Transport of Black Carbon between the South Edge of the North China Plain and Central China during Winter Haze Episodes, Atmospheric Chemistry and Physics, 19(7), 4499-4516.
[https://doi.org/10.5194/acp-19-4499-2019]

유희정 (국립기상과학원 기후연구부 연구사) (heejuyoo@korea.kr)
정민재 (국립기상과학원 기후연구부 연구원) (minjaeaa@korea.kr)
오상민 (국립기상과학원 기후연구부 연구원) (sangmin80@korea.kr)
정주용 (국립기상과학원 기후변화예측연구팀 연구관) (cychung@kma.go.kr)
이선란 (국립기상과학원 기후연구부 선임연구원) (sunranlee@korea.kr)
임세희 (충남대학교 환경공학과 교수) (saehee.lim@cnu.ac.kr)
김정은 (국립기상과학원 기후연구부 연구관) (narci76@korea.kr)
부경온 (국립기상과학원 기후연구부 부장) (kyungon@korea.kr)

